As astronomers face a veritable tsunami of data from new telescopes and observing programs in the coming years, a pair of researchers has developed a set of techniques that makes it easier for scientists to make high-quality visualizations of the data.
“The sheer volume of data that astronomers are encountering makes visualization a vital tool for understanding the results of their studies,” said Brian Kent, of the National Radio Astronomy Observatory (NRAO). Kent and Matias Garate of the Catholic Pontifical University of Chile in Santiago presented their work to the American Astronomical Society’s meeting in Austin, Texas.
While visualization has long been recognized as a powerful tool for scientific analysis, it also has, to a large extent, been considered the realm of specialists, rather than of frontline researchers. Software packages for data visualization are extremely capable, but often require significant learning time to become proficient in their use.
“We are taking visualization techniques from the black-belt experts and making them readily usable by any astronomer,” said Kent, who has written one book on scientific visualization and edited a special journal issue on the topic.
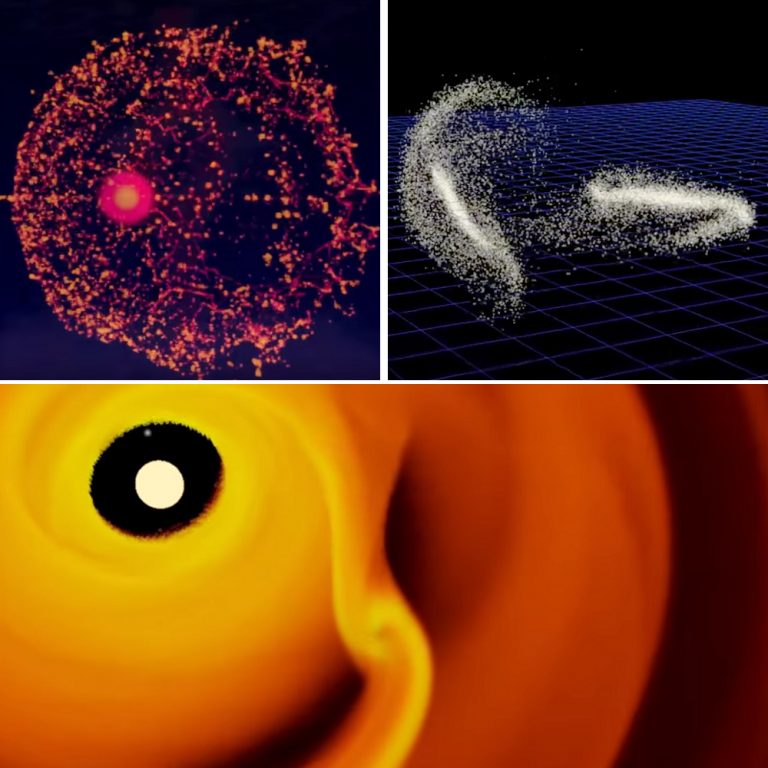
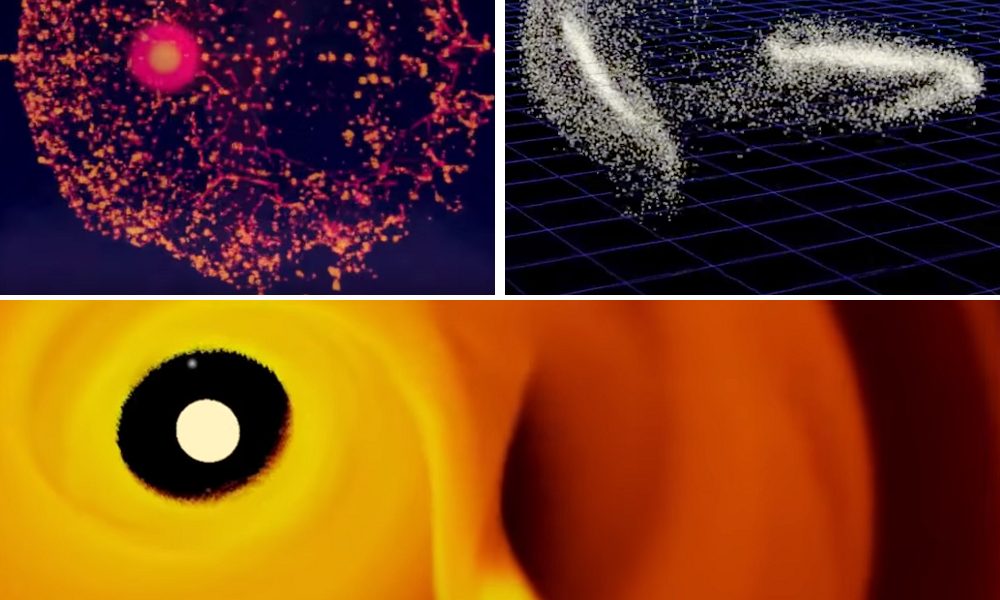
The astronomers prepared a detailed set of step-by-step instructions for using off-the-shelf visualization software to make three-dimensional data cubes from massive volumes of research data.
“Many scientifically-important features are much more readily visible in a 3-D visualization than in a 2-D plot,” Kent said. “In addition, the 3-D renderings make appealing displays that are not only useful for scientific presentations but also are effective for bringing the beauty and fascination of astronomy to the general public,” he added.
The cookbook-like techniques are usable on a variety of computing devices, including tablets and laptops.
New telescopes that are under construction or planned, along with observing programs that will quickly and repeatedly scan large regions of sky will produce amounts of data that will make visualization necessary as an analytical tool, the scientists said.
“We want to reduce the barriers and make powerful visualization tools available to the entire research community,” Kent said.
The techniques that Kent and Garate have developed are available online. Kent’s web site includes video tutorials, along with instructions, files, and examples to guide researchers in building their own visualization scenarios. Kent and Garate also have published papers in a new special Focus Issue from the Publications of the Astronomical Society of the Pacific:
http://iopscience.iop.org/journal/1538-3873/page/Techniques-and-Methods-for-Astrophysical-Data-Visualization
The National Radio Astronomy Observatory is a facility of the National Science Foundation, operated under cooperative agreement by Associated Universities, Inc. Gárate acknowledges affiliation with Millennium Nucleus “Protoplanetary Disks in ALMA Early Science,” and also acknowledges financial support from Millennium Nucleus RC130007 (Chilean Ministry of Economy), from FONDECYT grants 1141175 and 1150345, and Basal (PFB0609) grant.
###
MediaContact:
Dave Finley, Public Information Officer
(575) 835-7302
dfinley@nrao.edu