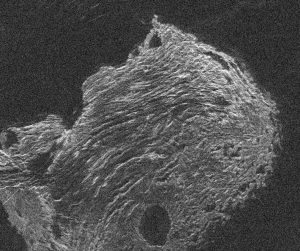
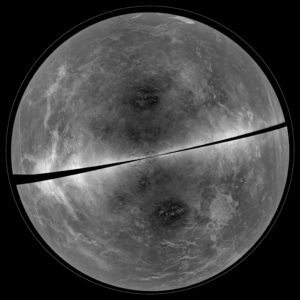
This is a radar image of the planet Venus made by transmitting a signal at 13 cm wavelength from Arecibo and using the Green Bank Telescope (GBT) to detect the reflection off its surface. Brighter parts of the image indicate a rougher surface, while dark regions are smoother (on centimeter to meter scales). Many features, including mountain ranges, volcanic domes, and craters can be seen.
Venus as Seen in Radar with the GBT
A projection of the radar data of Venus collected in 2012. Striking surface features — like mountains and ridges — are easily seen. The black diagonal band at the center represents areas too close to the Doppler “equator” to obtain well-resolved image data. By combining the highly sensitive receiving capabilities of the National Science Foundation’s (NSF) Green Bank Telescope (GBT) and the powerful radar transmitter at the NSF’s Arecibo Observatory, astronomers were able to make remarkably detailed images of the surface of this planet without ever leaving Earth. The radar signals from Arecibo passed through both our planet’s atmosphere and the atmosphere of Venus, where they hit the surface and bounced back to be received by the GBT in a process known as bistatic radar.
The Chromosphere of our Sun
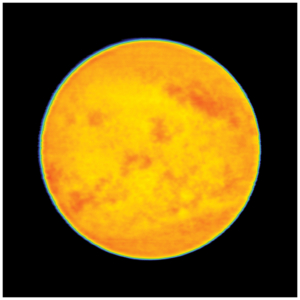
The brightest features have a brightness temperature of about 6500 K, and the darkest features have a brightness temperature of about 5500 K.
Saturn in Radio Waves
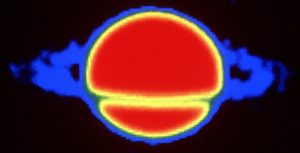
This is Saturn, as seen by the Very Large Array (VLA). Note the bright disk of the planet with a gradual fading toward the edge, called limb darkening. This illustrates a gradual cooling outward in Saturn’s atmosphere. The rings are seen in emission outside the disk but then in front of the planet they absorb the radiation from the bright disk behind, appearing as a dark band. In visual light they appear bright everywhere because they reflect the incident sunlight but at radio wavelengths the sunlight is fainter and we see the actual emission from Saturn.
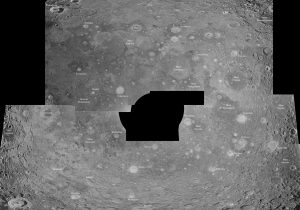
Radar Map of Our Moon
Radar maps of the Moon can look like optical images, but they represent the amount of energy reflected back toward the transmitter by any given part of the Moon’s surface. The Arecibo Telescope’s radar wavelength of 70 cm penetrates 10 meters or more into the very dry lunar surface. When picked up by the Green Bank Telescope (GBT), the radar shows us variations in the abundance of rocks larger than about 10 cm in diameter and differences in the chemistry of rocks that form the Moon’s crust.

Moon as seen by ALMA
First radio image of the Moon taken with a 12-meter ALMA antenna. The optical image at left shows the sunlight reflected by the Moon’s surface, whereas the radio image shows the physical temperature distribution of the Moon. The ALMA image clearly shows the temperature distribution of the Moon, including weak radio emission from the dark side of the Moon.


