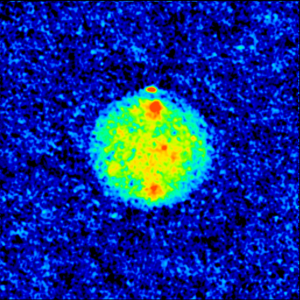
This image of Mercury was the result of a radar experiment using the NASA JPL/DSN 70-m antenna in Goldstone, CA, as the transmitter, and the Very Large Array (VLA) as the receiver. Red areas are areas of high radar reflectivity, which can either be a result of surface and near-surface composition, or surface roughness. The north pole is the brightest region, an indication of the presence of significant amounts of water ice. A similar region has been detected at the south polar regions. The two other large reflective regions have never been photographed, so the cause of the high reflections remains a mystery.
Radar Image of Mars
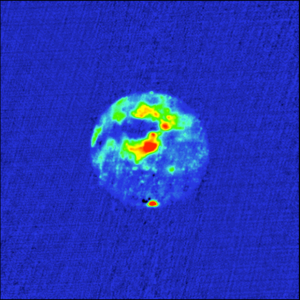
This is a radar image of Mars, made with the NASA Goldstone-Very Large Array (VLA) radar system in 1988. Red areas are areas of high radar reflectivity. The south polar ice cap, at the bottom of the image, is the area of highest reflectivity. The other areas of high reflectivity are associated with the giant shield volcanoes of the Tharsis ridge. The dark area to the West of the Tharsis ridge showed no detectable radar echoes. The investigators call this region the “Stealth” region and believe it is a huge deposit of low density, volcanic ash with an absence of volume scatterers (rocks) to depths of many meters.
HCN in Titan’s Atmosphere
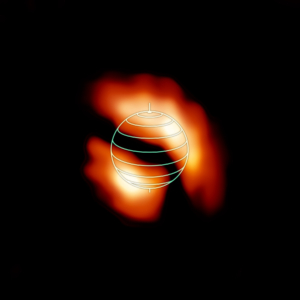
ALMA image of the distribution of the organic molecule HCN in the upper atmosphere of Saturn’s moon Titan. The denser, brighter concentrations are shown near the moon’s north and south poles. Their shifted, off-axis locations were unexpected and could help researchers better understand Titan’s complex atmospheric processes. The globe outline represents Titan’s orientation at the time of the observations.
HC3N in Titan’s Upper Atmosphere
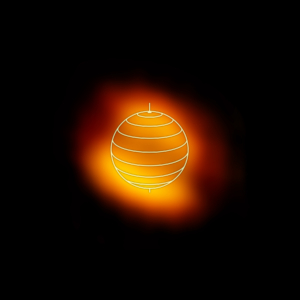
ALMA image of the distribution of the organic molecule HC3N in the upper atmosphere of Saturn’s moon Titan. The denser, brighter concentrations are shown near the moon’s north and south poles. Their shifted, off-axis locations were unexpected and could help researchers better understand Titan’s complex atmospheric processes. The globe outline represents Titan’s orientation at the time of the observations.
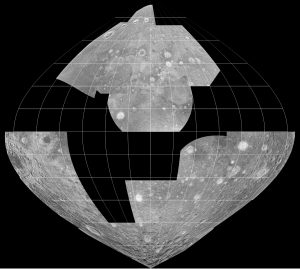
Craters in Radar
Partial mosaic of 70 cm radar images of nearside of the moon taken by the Green Bank Telescope (GBT) from radio waves transmitted by the Arecibo Telescope.
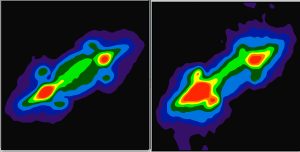
A Comet Hits Jupiter
This pair of radio images taken by the Very Large Array (VLA) shows the planet Jupiter before (left – June 24, 1994) and after (right July 19, 1994) fragments of the comet Shoemaker-Levy 9 struck the planet in 1994. The disk of the planet is in the center of the images. The bright red spots are regions high above Jupiter’s “surface” where electrons interacting with the planet’s intense magnetic field are producing strong radio emission. These “radiation belts” are similar to the Van Allen Radiation Belts discovered above the Earth in 1958.


