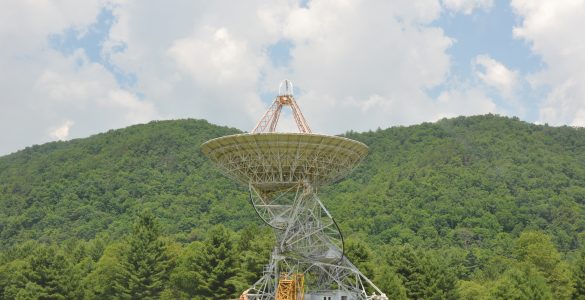
Chart Recorder in Green Bank
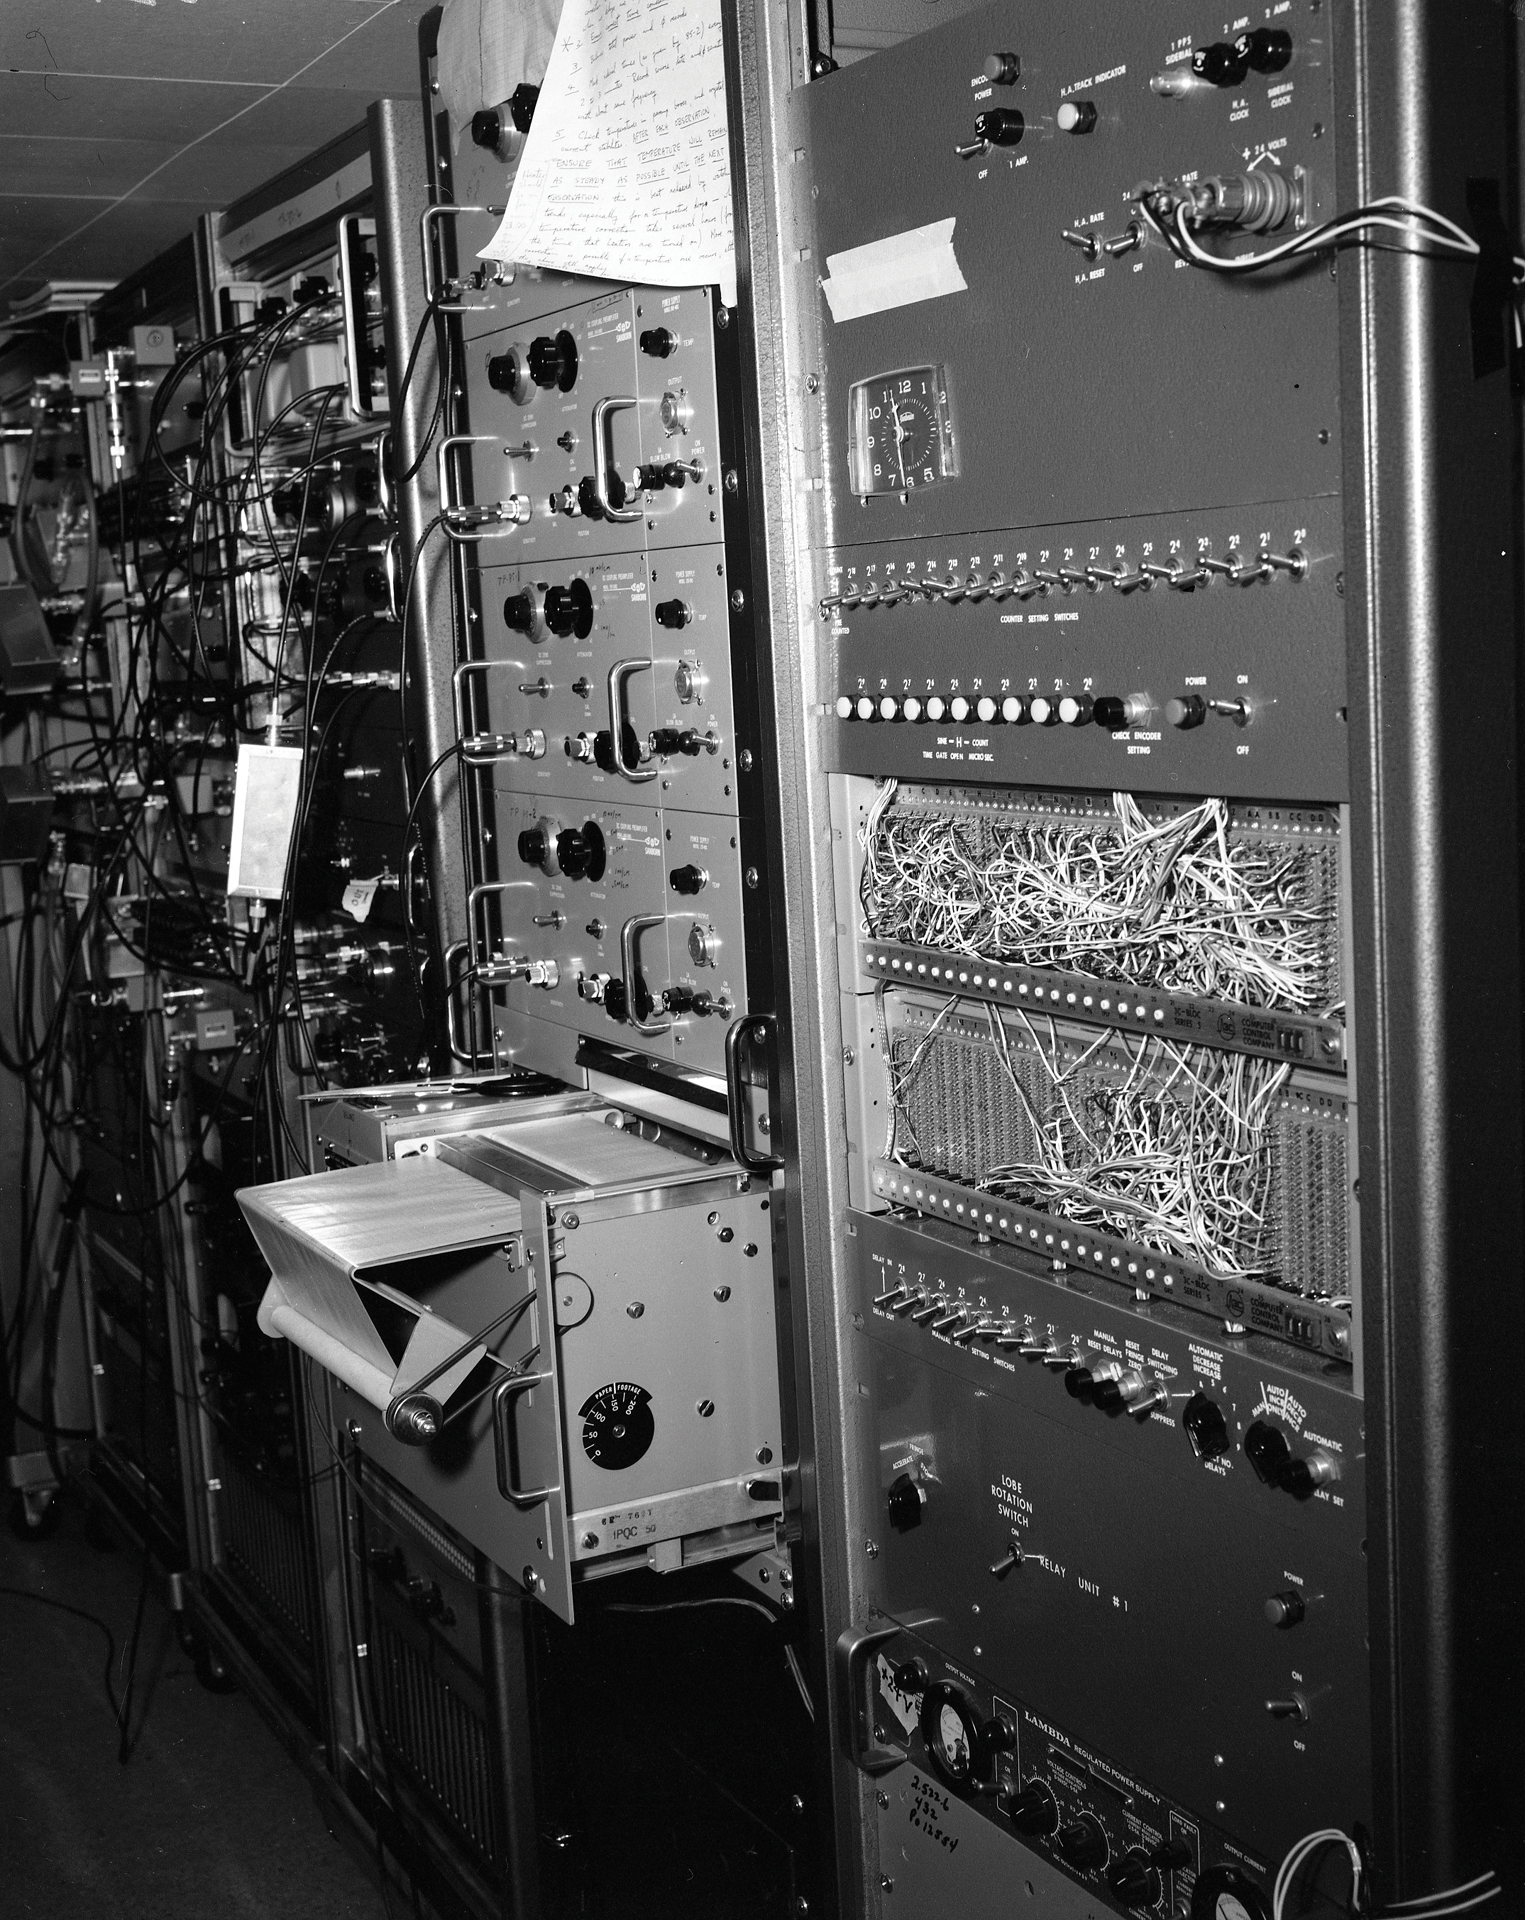
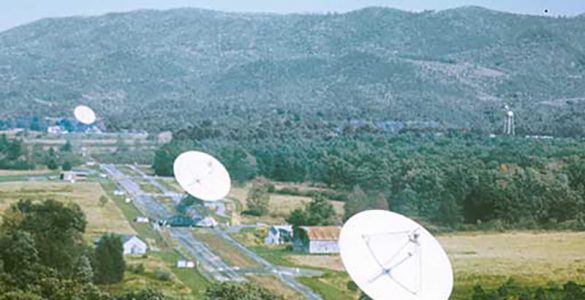
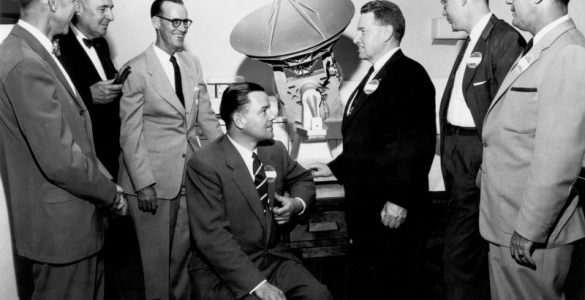
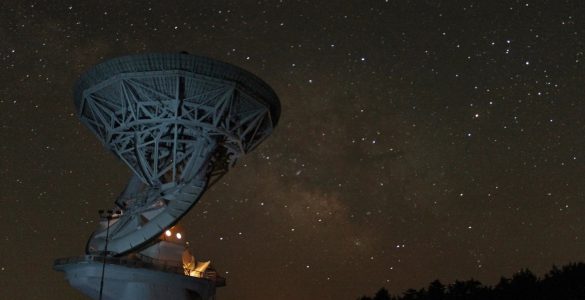
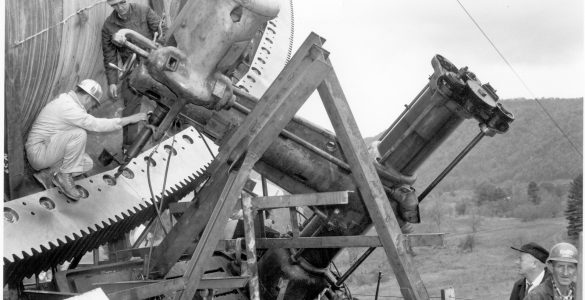
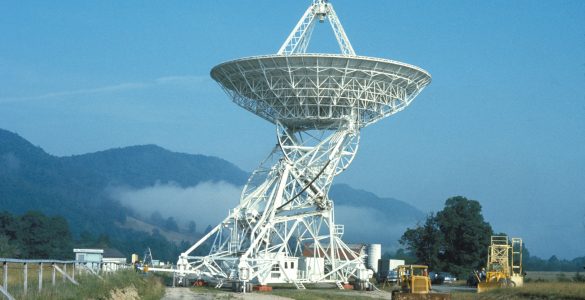
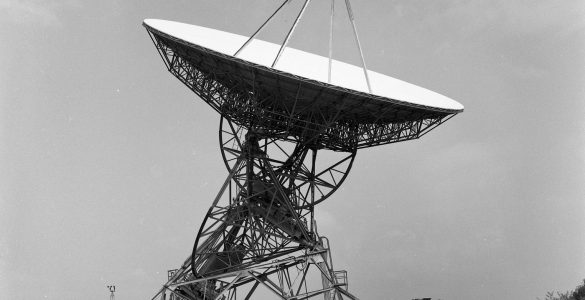
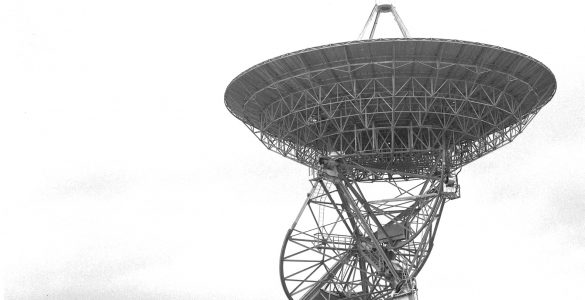
In the 1960s and 1970s, this was a state-of-the-art supercalculator known as an autocorrelator. Its job was to combine the data taken by the Green Bank Interferometer’s four antennas and produce a single data package from them. The output was a plot produced by a chart recorder. A common sight during these years was of astronomers studying long rolls of GBI data plots in the hallways.
Credit: NRAO/AUI/NSF
Download Image download
Have you reviewed our Media Use Policy?
Yes, continue arrow_circle_right


