Spectral Lines in the Cat’s Paw Nebula
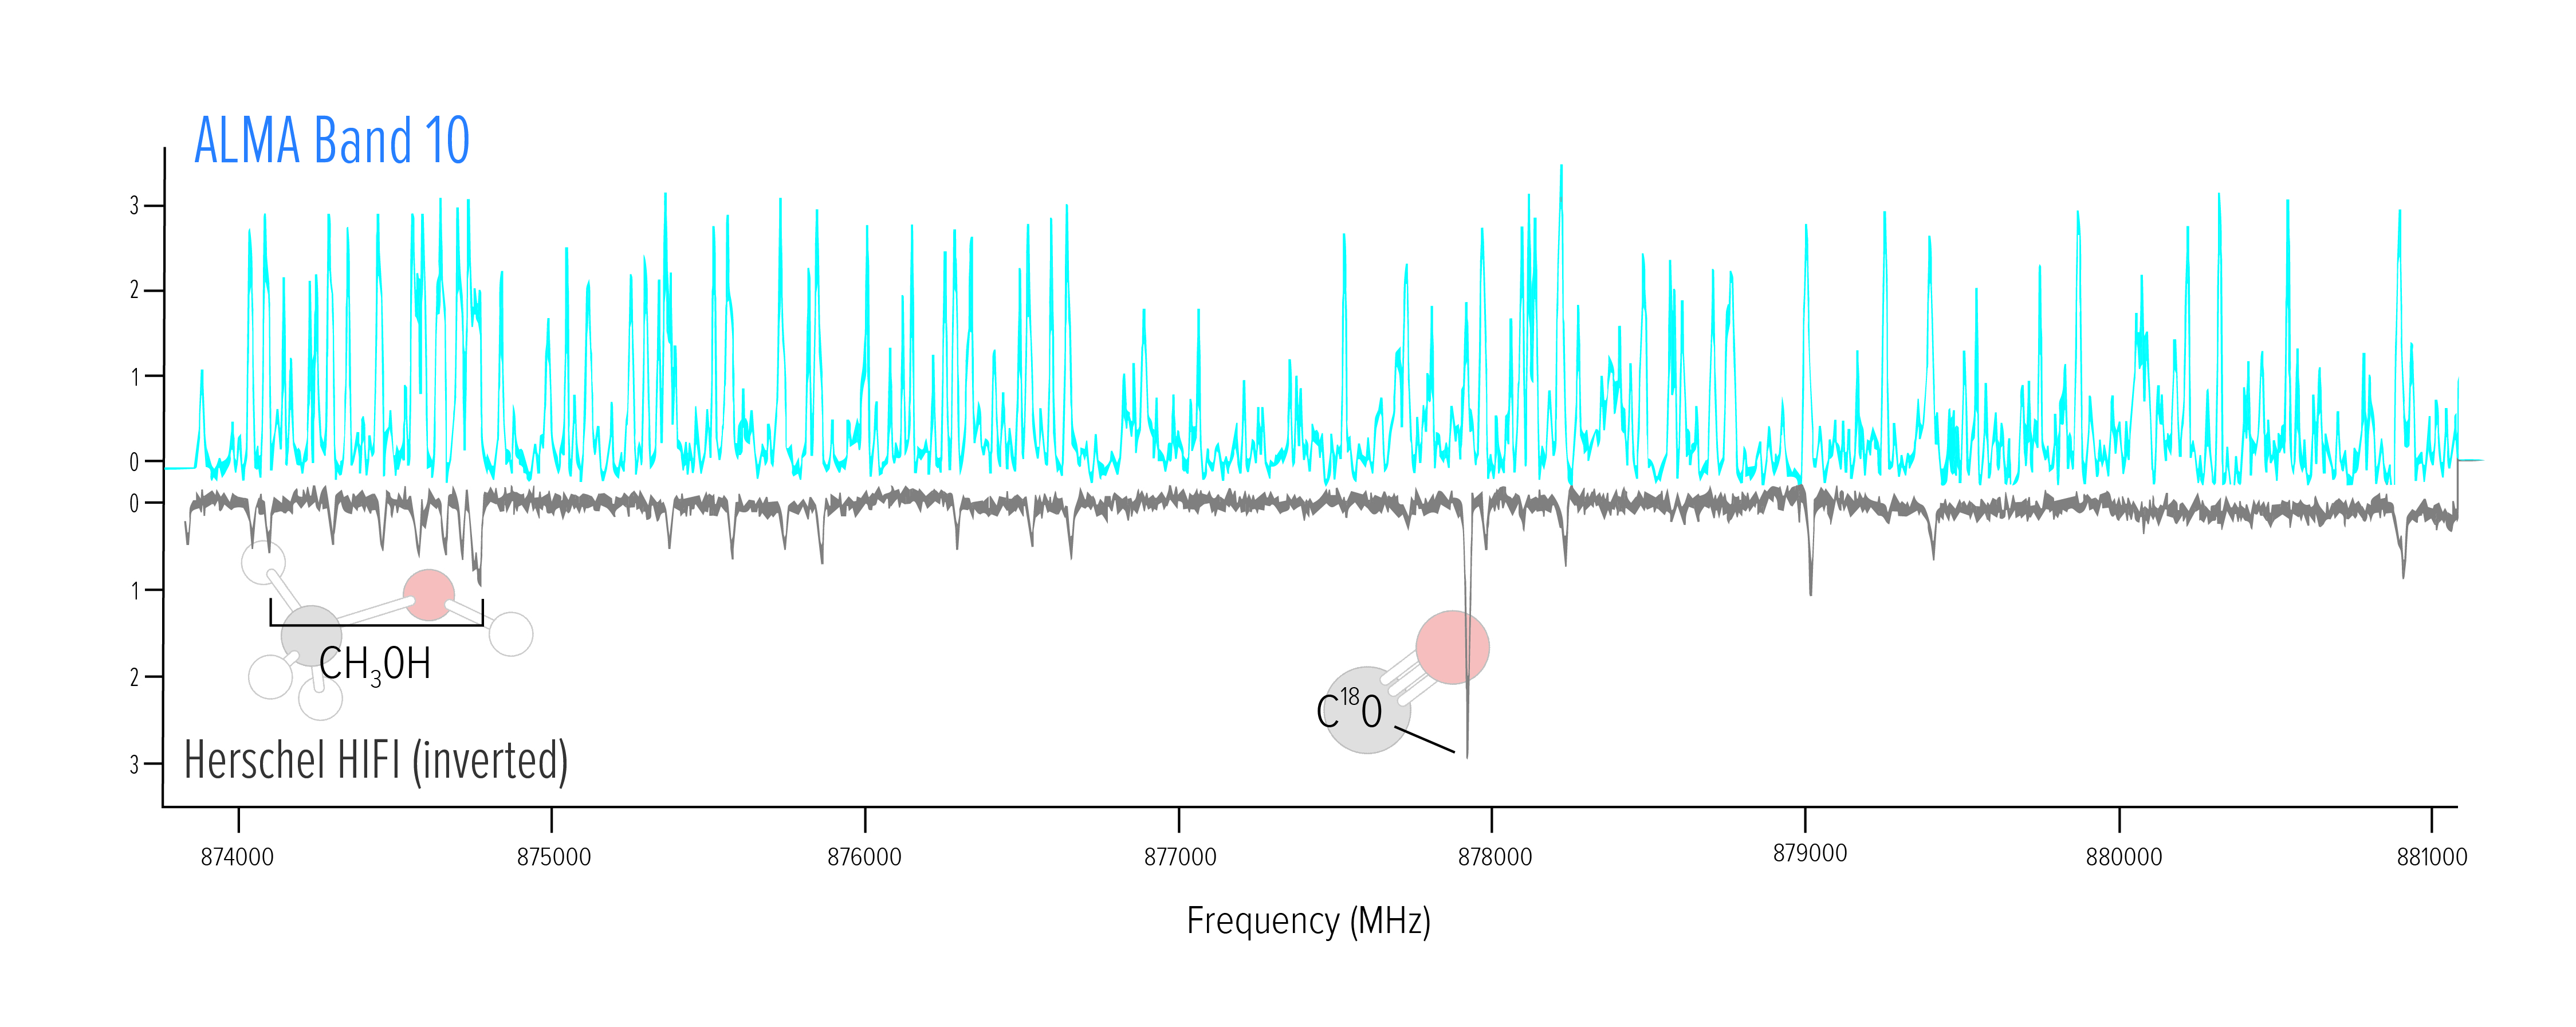
The upper blue portion of this graph shows the spectral lines ALMA detected in a star-forming region of the Cat’s Paw Nebula. The lower black portion shows the lines detected by the European Space Agency’s Herschel Space Observatory. The ALMA observations detected more than ten times as many spectral lines. Note that the Herschel data have been inverted for comparison. Two molecular lines are labeled for reference.
Credit: NRAO/AUI/NSF, B. McGuire et al.
Download Image download
Have you reviewed our Media Use Policy?
Yes, continue arrow_circle_right


